




















No. We teach analytics from scratch, starting with Excel and statistics and progressing to SQL, Python and BI tools.
Master Python, SQL, Excel & Power BI and build real-world dashboards with industry mentorship, and guaranteed job placement.
Next batch starts
SELECT you.name, offer.company, offer.role
FROM students AS you
JOIN offers AS offer ON offer.student = you.id
WHERE you.skills @> ARRAY[
'Excel', 'SQL', 'Python', 'Power BI'
]
AND you.dashboards >= 5
ORDER BY offer.ctc DESC;→3 offers returned · placement support until hired
Program Benefits
100% job assistance until you get placed.
Learn from experienced professionals.
Build 5+ industry-ready dashboards.
Graduate with a professional portfolio.
Course Journey
From analytics foundations to real projects, AI tools and job readiness, with guaranteed placement support at the finish line.
Master statistics, data types, and descriptive analytics. Clean and prepare data, and build quick analyses and dashboards in Excel.
Extract, filter and aggregate data with SQL: joins, subqueries, and window functions on real databases.
Wrangle and analyse data with Python, Pandas and NumPy. Automate repetitive data tasks.
Build interactive dashboards and reports with Power BI and Tableau; master EDA and business storytelling.
Use AI tools for analysts, build capstone projects, and prepare with aptitude training and mock interviews.
Detailed Curriculum
A structured module-by-module learning path designed by industry experts.
Build a strong foundation with Excel, statistics, data cleaning, and Exploratory Data Analysis (EDA). Learn to think in data.
Query data with SQL, analyse with Python (Pandas, NumPy), and build dashboards in Power BI and Tableau.
Work on end-to-end analytics projects, business storytelling, and AI-assisted reporting that recruiters value.
Modules
TAP Academy's exclusive VIBE framework shows you how to use AI tools to accelerate analysis, reporting and dashboards: the exact skills recruiters look for in fresh talent.
You
Analyse this sales data and find the trends
GenerateTAP AI
done in 4.2s
your-app.tap.dev
Live · built entirely from a sentence
Ship faster with the modern AI toolchain, and graduate with insights, not just notes.
The toolchain you'll live in
GitHub CopilotBBoltVV0LLovableWWindsurf

GitHub CopilotBBoltVV0LLovableWWindsurfTools & Technologies
Master industry-standard analytics tools and technologies used by professional data analysts worldwide.
AI assistant for coding help, reasoning and complex questions.
AI chatbot for coding help, brainstorming and content creation.

Suggests code snippets and completes functions as you type.
AI-powered editor for writing, debugging and refactoring.
Data cleaning, formulas, pivot tables and quick analysis.
Extract, filter and aggregate data from relational databases.
Programming language for data wrangling and automation.
Python library for manipulating and analysing tabular data.
Python library for fast numerical computing and arrays.
Microsoft BI tool for interactive dashboards and reports.
Visual analytics platform for interactive dashboards.
Python library for statistical data visualization and EDA.
Capstone Projects
Build real dashboards and case studies that showcase your skills and create an impressive portfolio for employers.

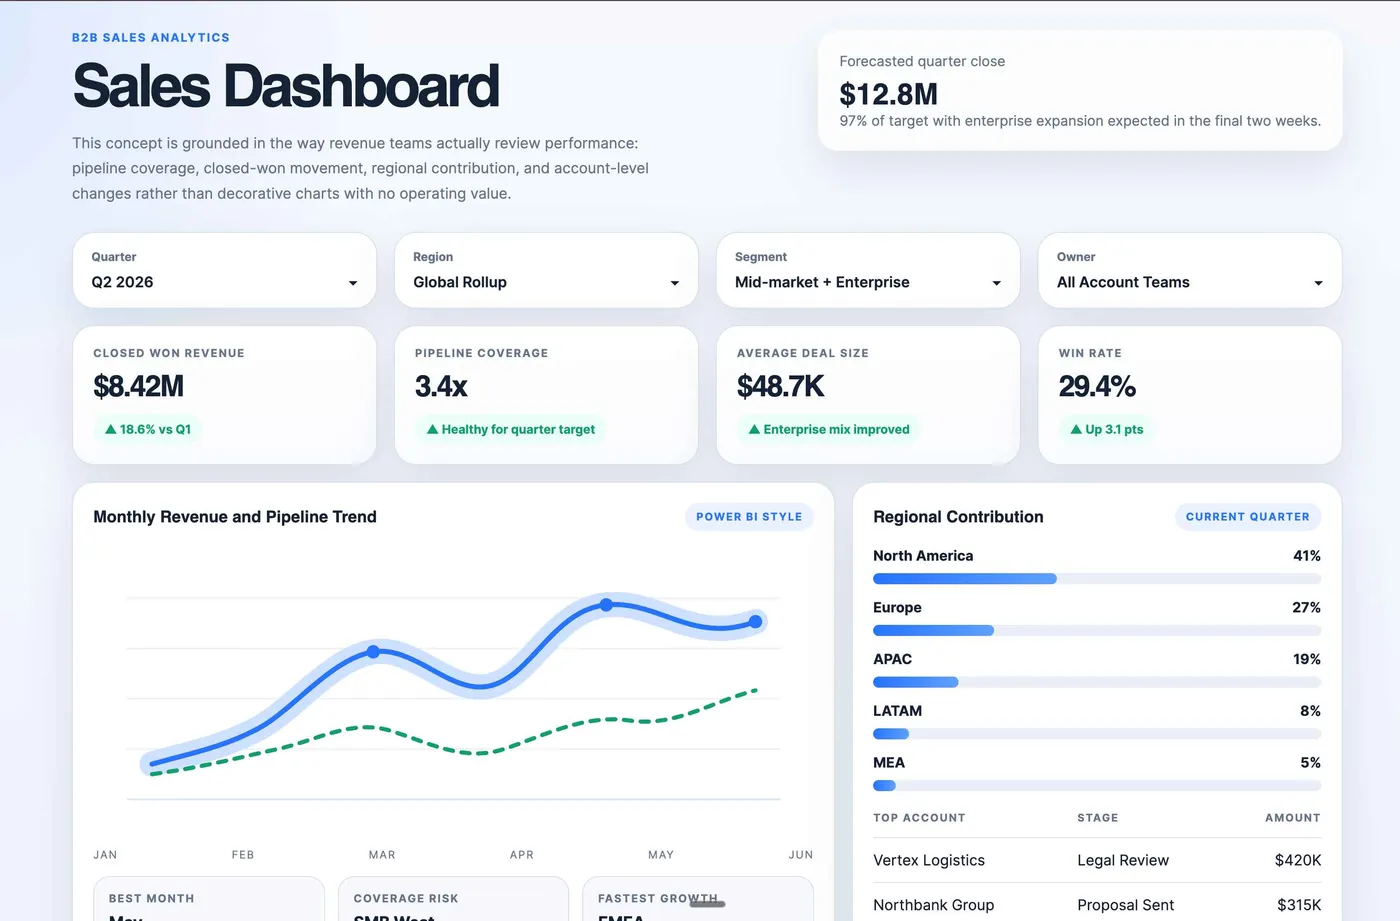
Track performance, revenue & growth with an interactive Power BI dashboard built on real sales data.

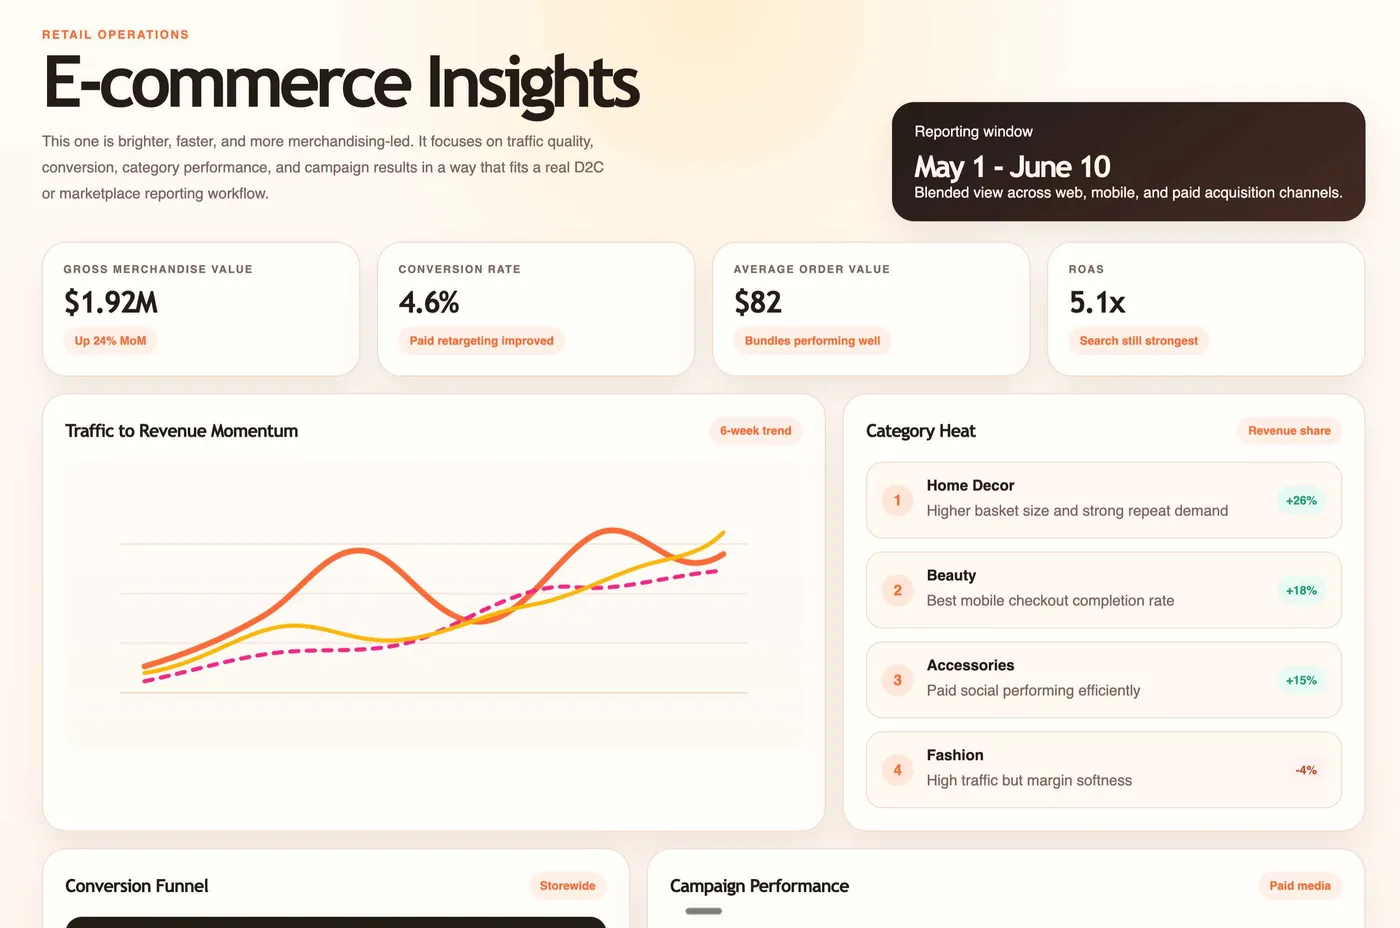
Uncover trends, behavior & product insights from e-commerce data using SQL and visual analytics.

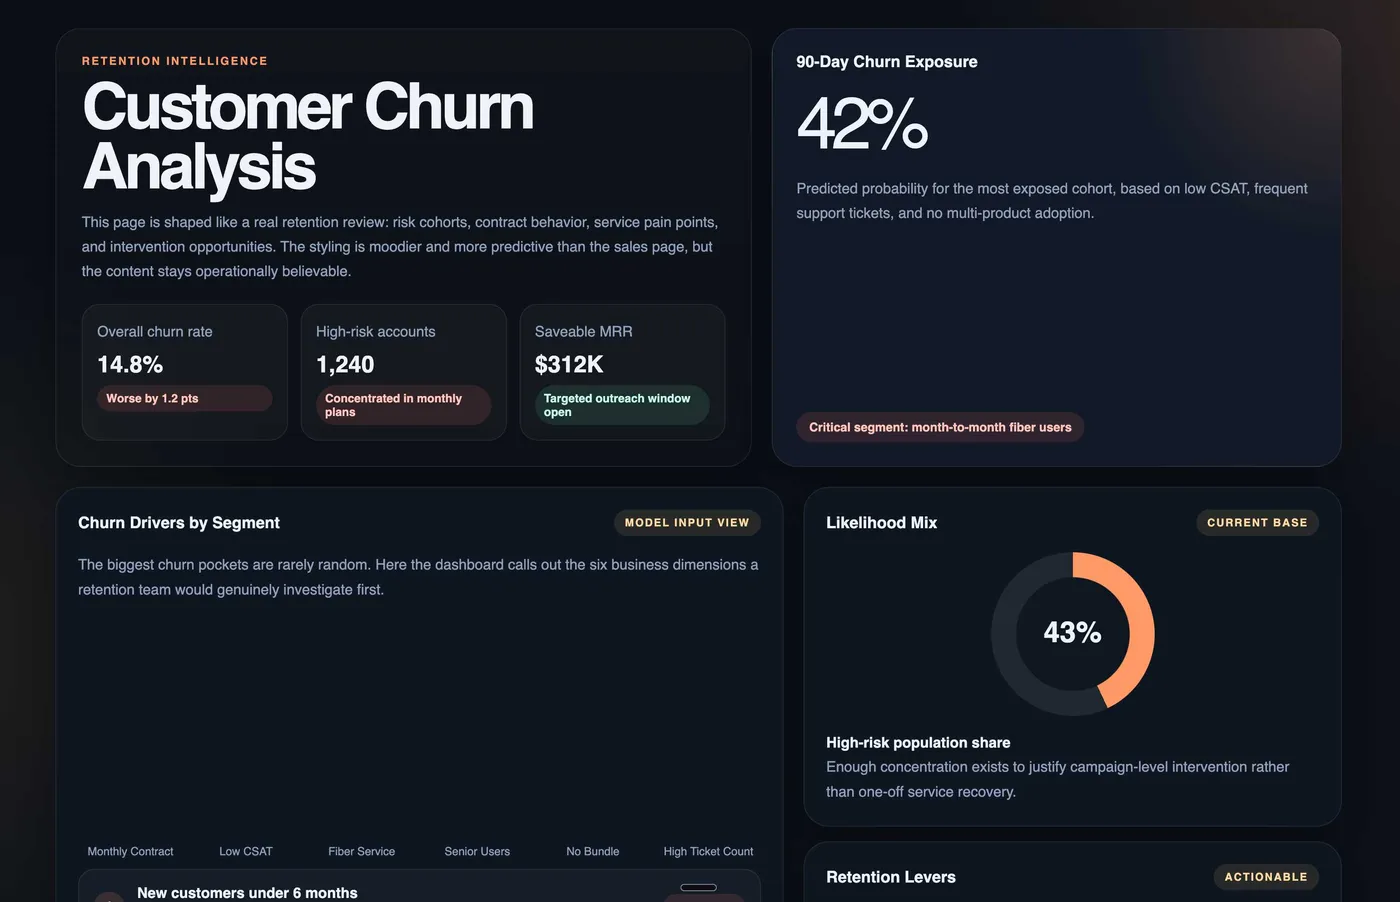
Analyze churn drivers & reduce customer loss using Python, Pandas and statistical analysis.

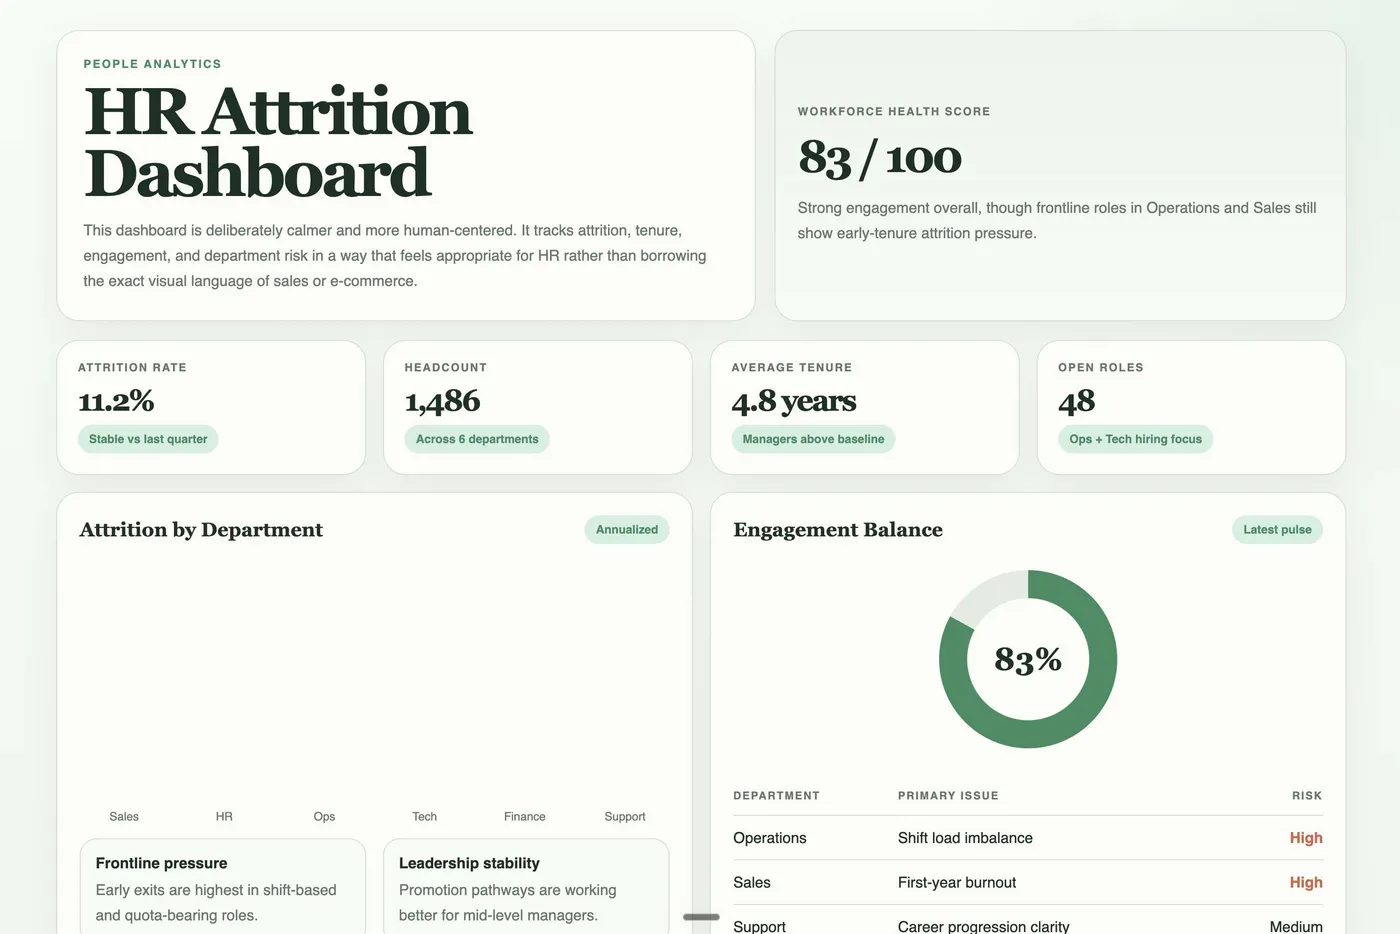
Identify attrition patterns & improve retention with an interactive Tableau dashboard.
Start with these industry-relevant projects. They showcase your skills to employers and help you land the job.
Start Building Projects
Placement Success
Our graduates are working at top companies worldwide, building successful careers in data analytics, backed by 2,700+ hiring partners.


Course FAQs
No. We teach analytics from scratch, starting with Excel and statistics and progressing to SQL, Python and BI tools.
Real dashboards and case studies: a Sales Dashboard, Customer Churn analysis, E-commerce Insights, an HR Attrition Dashboard, and an end-to-end capstone case study.
Both online and offline (hybrid), with a duration of about 4 months (around 9–12 hours per week including live sessions and study).